🗺️ AI@Flows Dashboard
The Dashboard has two views, chosen with the switch at the top:
| View | What it shows |
|---|---|
| Integration overview | One SAP system in the centre with its applications and interfaces: direction, technology, business objects and status |
| Application landscape | Which application instances (DEV, TEST, PROD …) each SAP system is connected to – today on the ECC systems and after the re-plug on the S/4HANA systems |
Both views have a search pane on the left with collapsible blocks (click the ▸ arrow; the app remembers which blocks are open). Ticking an item in a long list keeps the list where it is.
Integration overview
The Integration overview draws the application diagram of one SAP system: the system in the centre, one box per connected application, and one link per interface. Use it in workshops, status meetings or architecture documents.
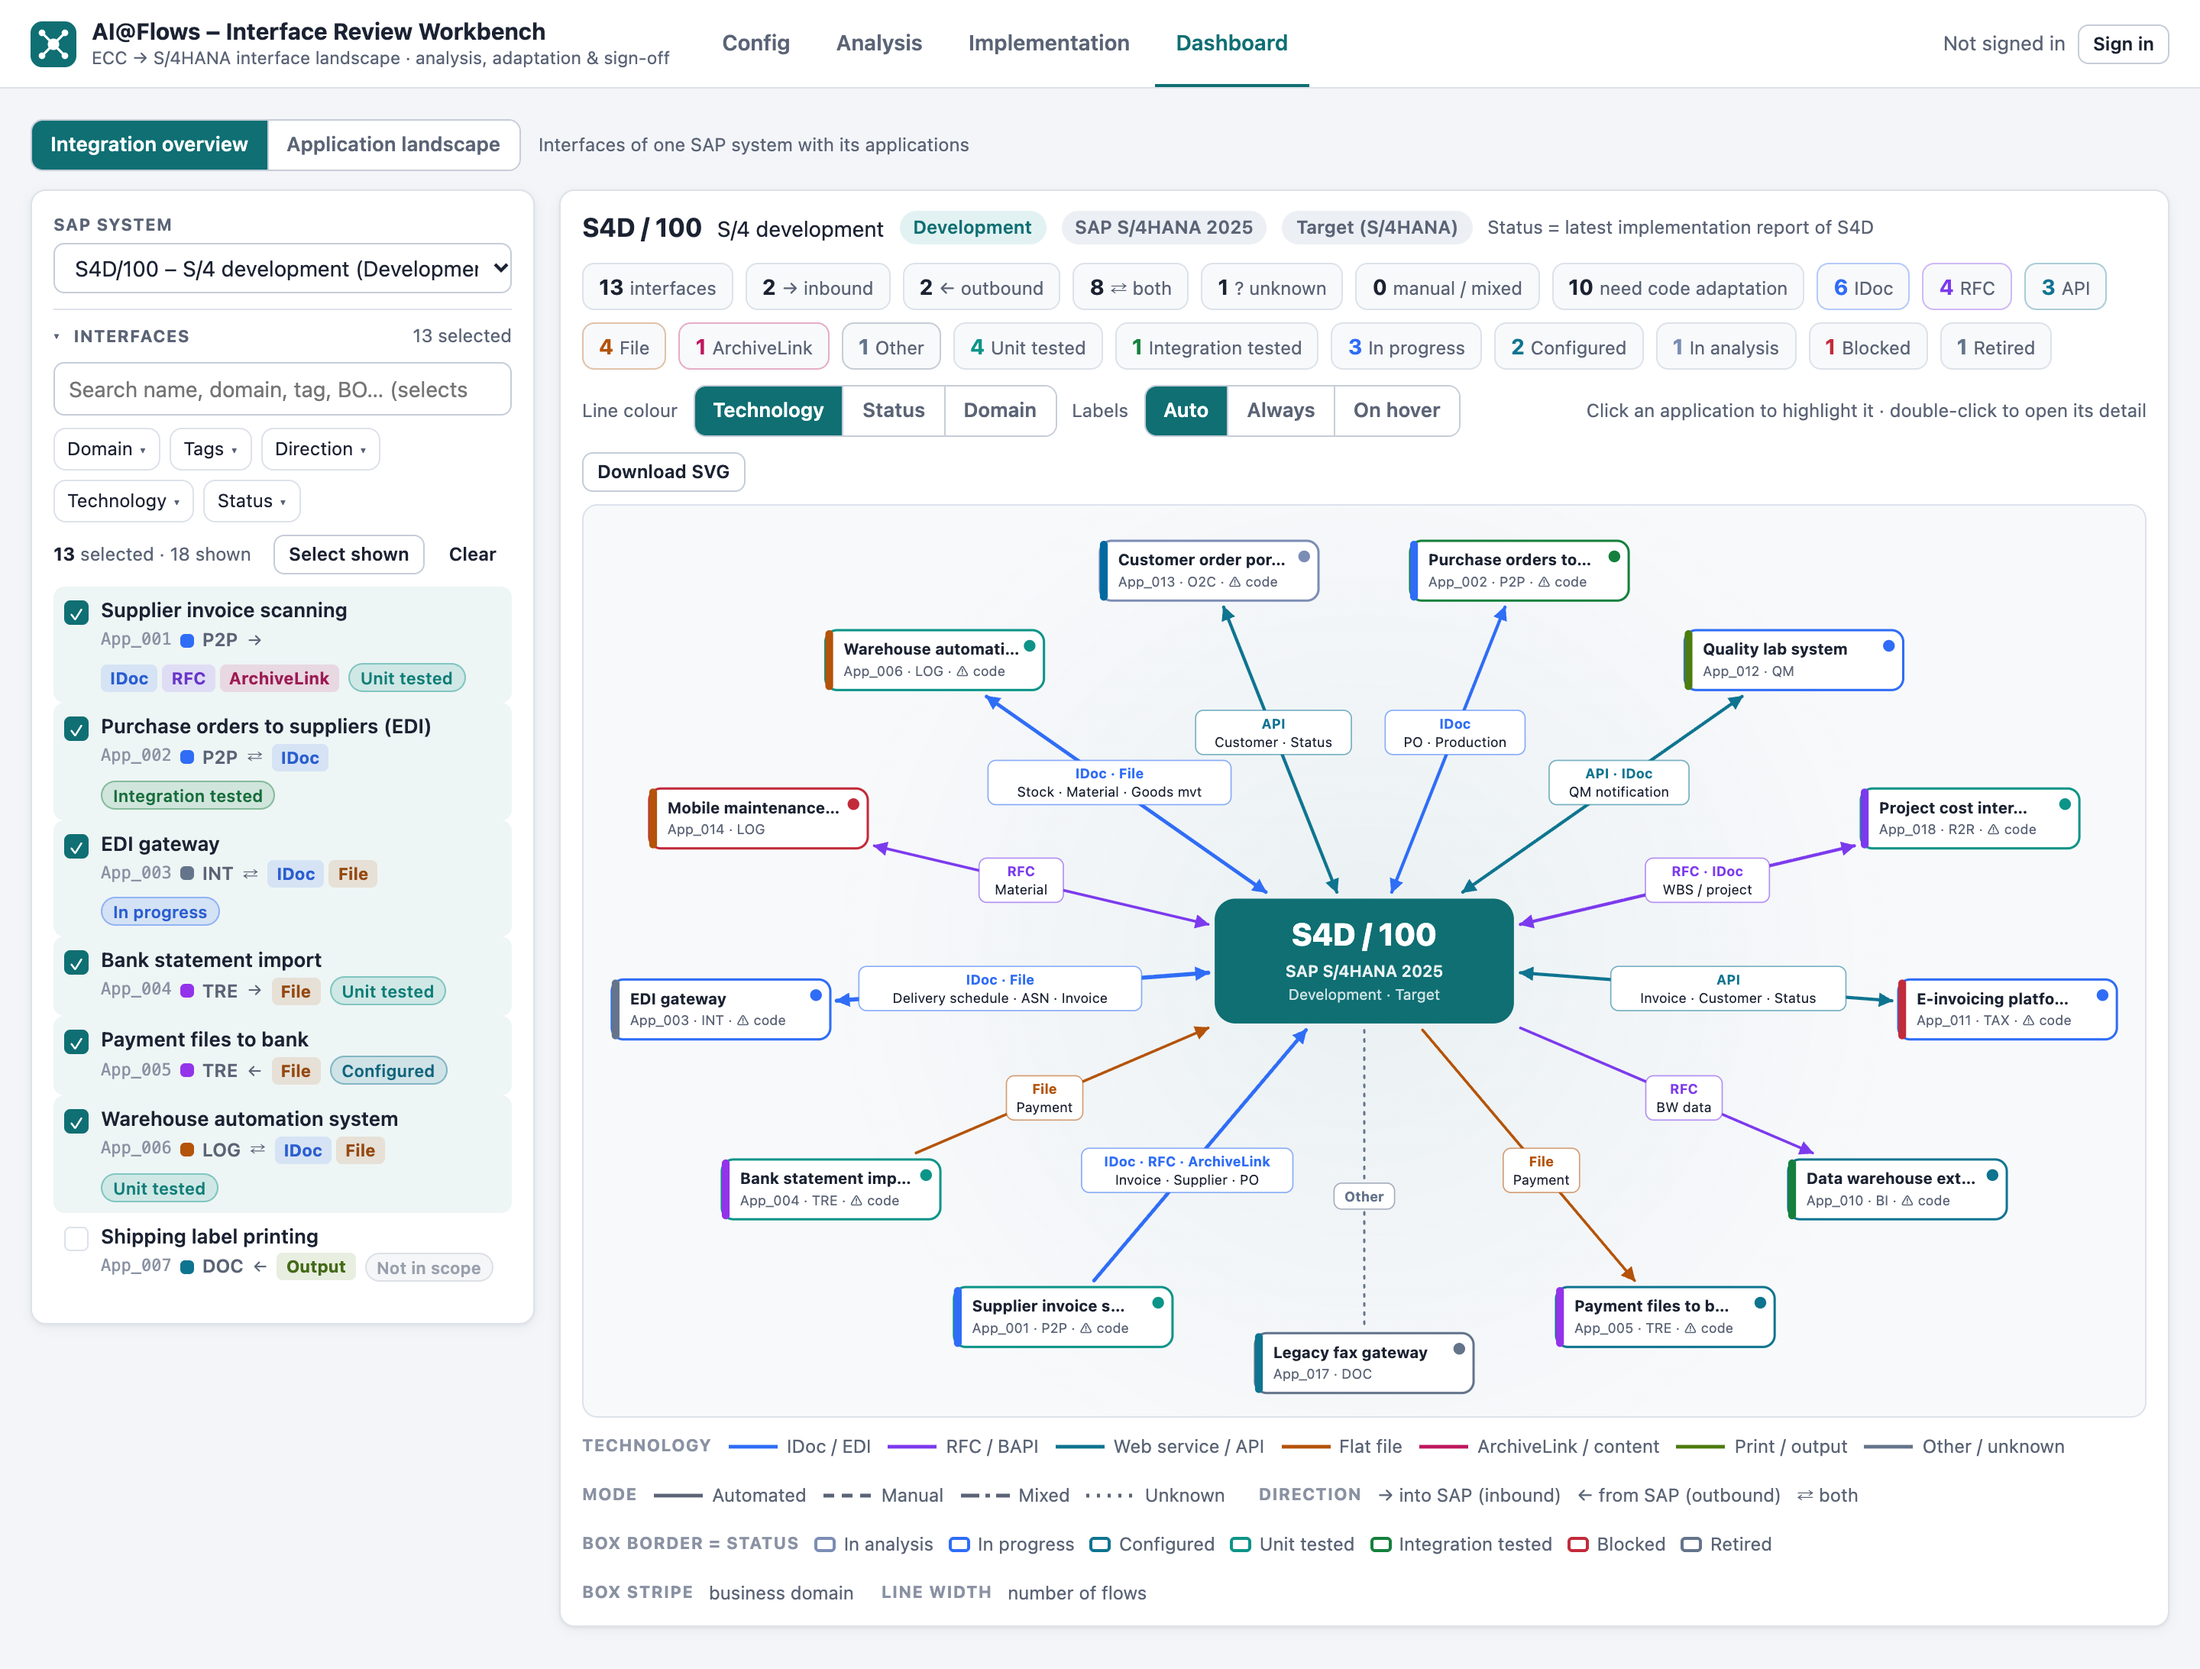
1 — Choose a SAP system
Select the system in SAP system (top of the left pane). The list comes from Config › SAP systems, source first, then targets by tier.
The header above the diagram shows the SID and client, name, tier, product and landscape, and where the status comes from:
- for a system with its own analysis file: the evidence found in that analysis
- for a target system: the latest implementation report of that system (interfaces without a report show as Not in scope)
Mini-KPIs summarise the selection: number of interfaces, inbound / outbound / both, manual or mixed, interfaces that need code adaptation, and counts per technology and status.
2 — Select interfaces
The Interfaces block holds the search, the filters and the list. The search is fuzzy and works on names, domain codes and tags: typing a domain code such as P2P, a tag, or part of an application name selects all matching interfaces. If more interfaces mention the text only in their details, a link offers to include them too (+ n more interface(s) mention …); Search names, domains and tags only switches back.
Narrow the list with the Domain, Tags, Direction, Technology and Status filters, then:
| Button | Effect |
|---|---|
| Select shown | Select all interfaces in the list |
| Clear | Deselect all |
| Reset | Reset search and filters |
You can also tick and untick single interfaces in the list.
3 — Read the diagram
| Element | Meaning |
|---|---|
| Centre | The selected SAP system |
| Box | An application (interface). The border colour is the status; the stripe is the business domain |
| Arrow | Direction: → into SAP (inbound), ← from SAP (outbound), ⇄ both |
| Line colour | Technology (default), status or domain, set with Line colour |
| Line style | Solid = automated · dashed = manual · dash-dot = mixed · dotted = unknown |
| Line width | Number of flows |
| Label on the link | The technology and the business objects exchanged (e.g. PO, GR, INV) |
Labels controls when link labels are shown: Auto, Always or On hover. A legend below the diagram explains the colours in use.
4 — Interact
- Click an application box to highlight it and open its flow card below the diagram: direction, technology, mode and status, and per flow the business objects, technology and volume over 13 months. Open implementation and Open analysis jump to the interface on those pages.
- Double-click a box (or a row in the list) to open the interface detail on the Analysis page. The detail then shows Back to dashboard, which returns to the same system, selection and diagram.
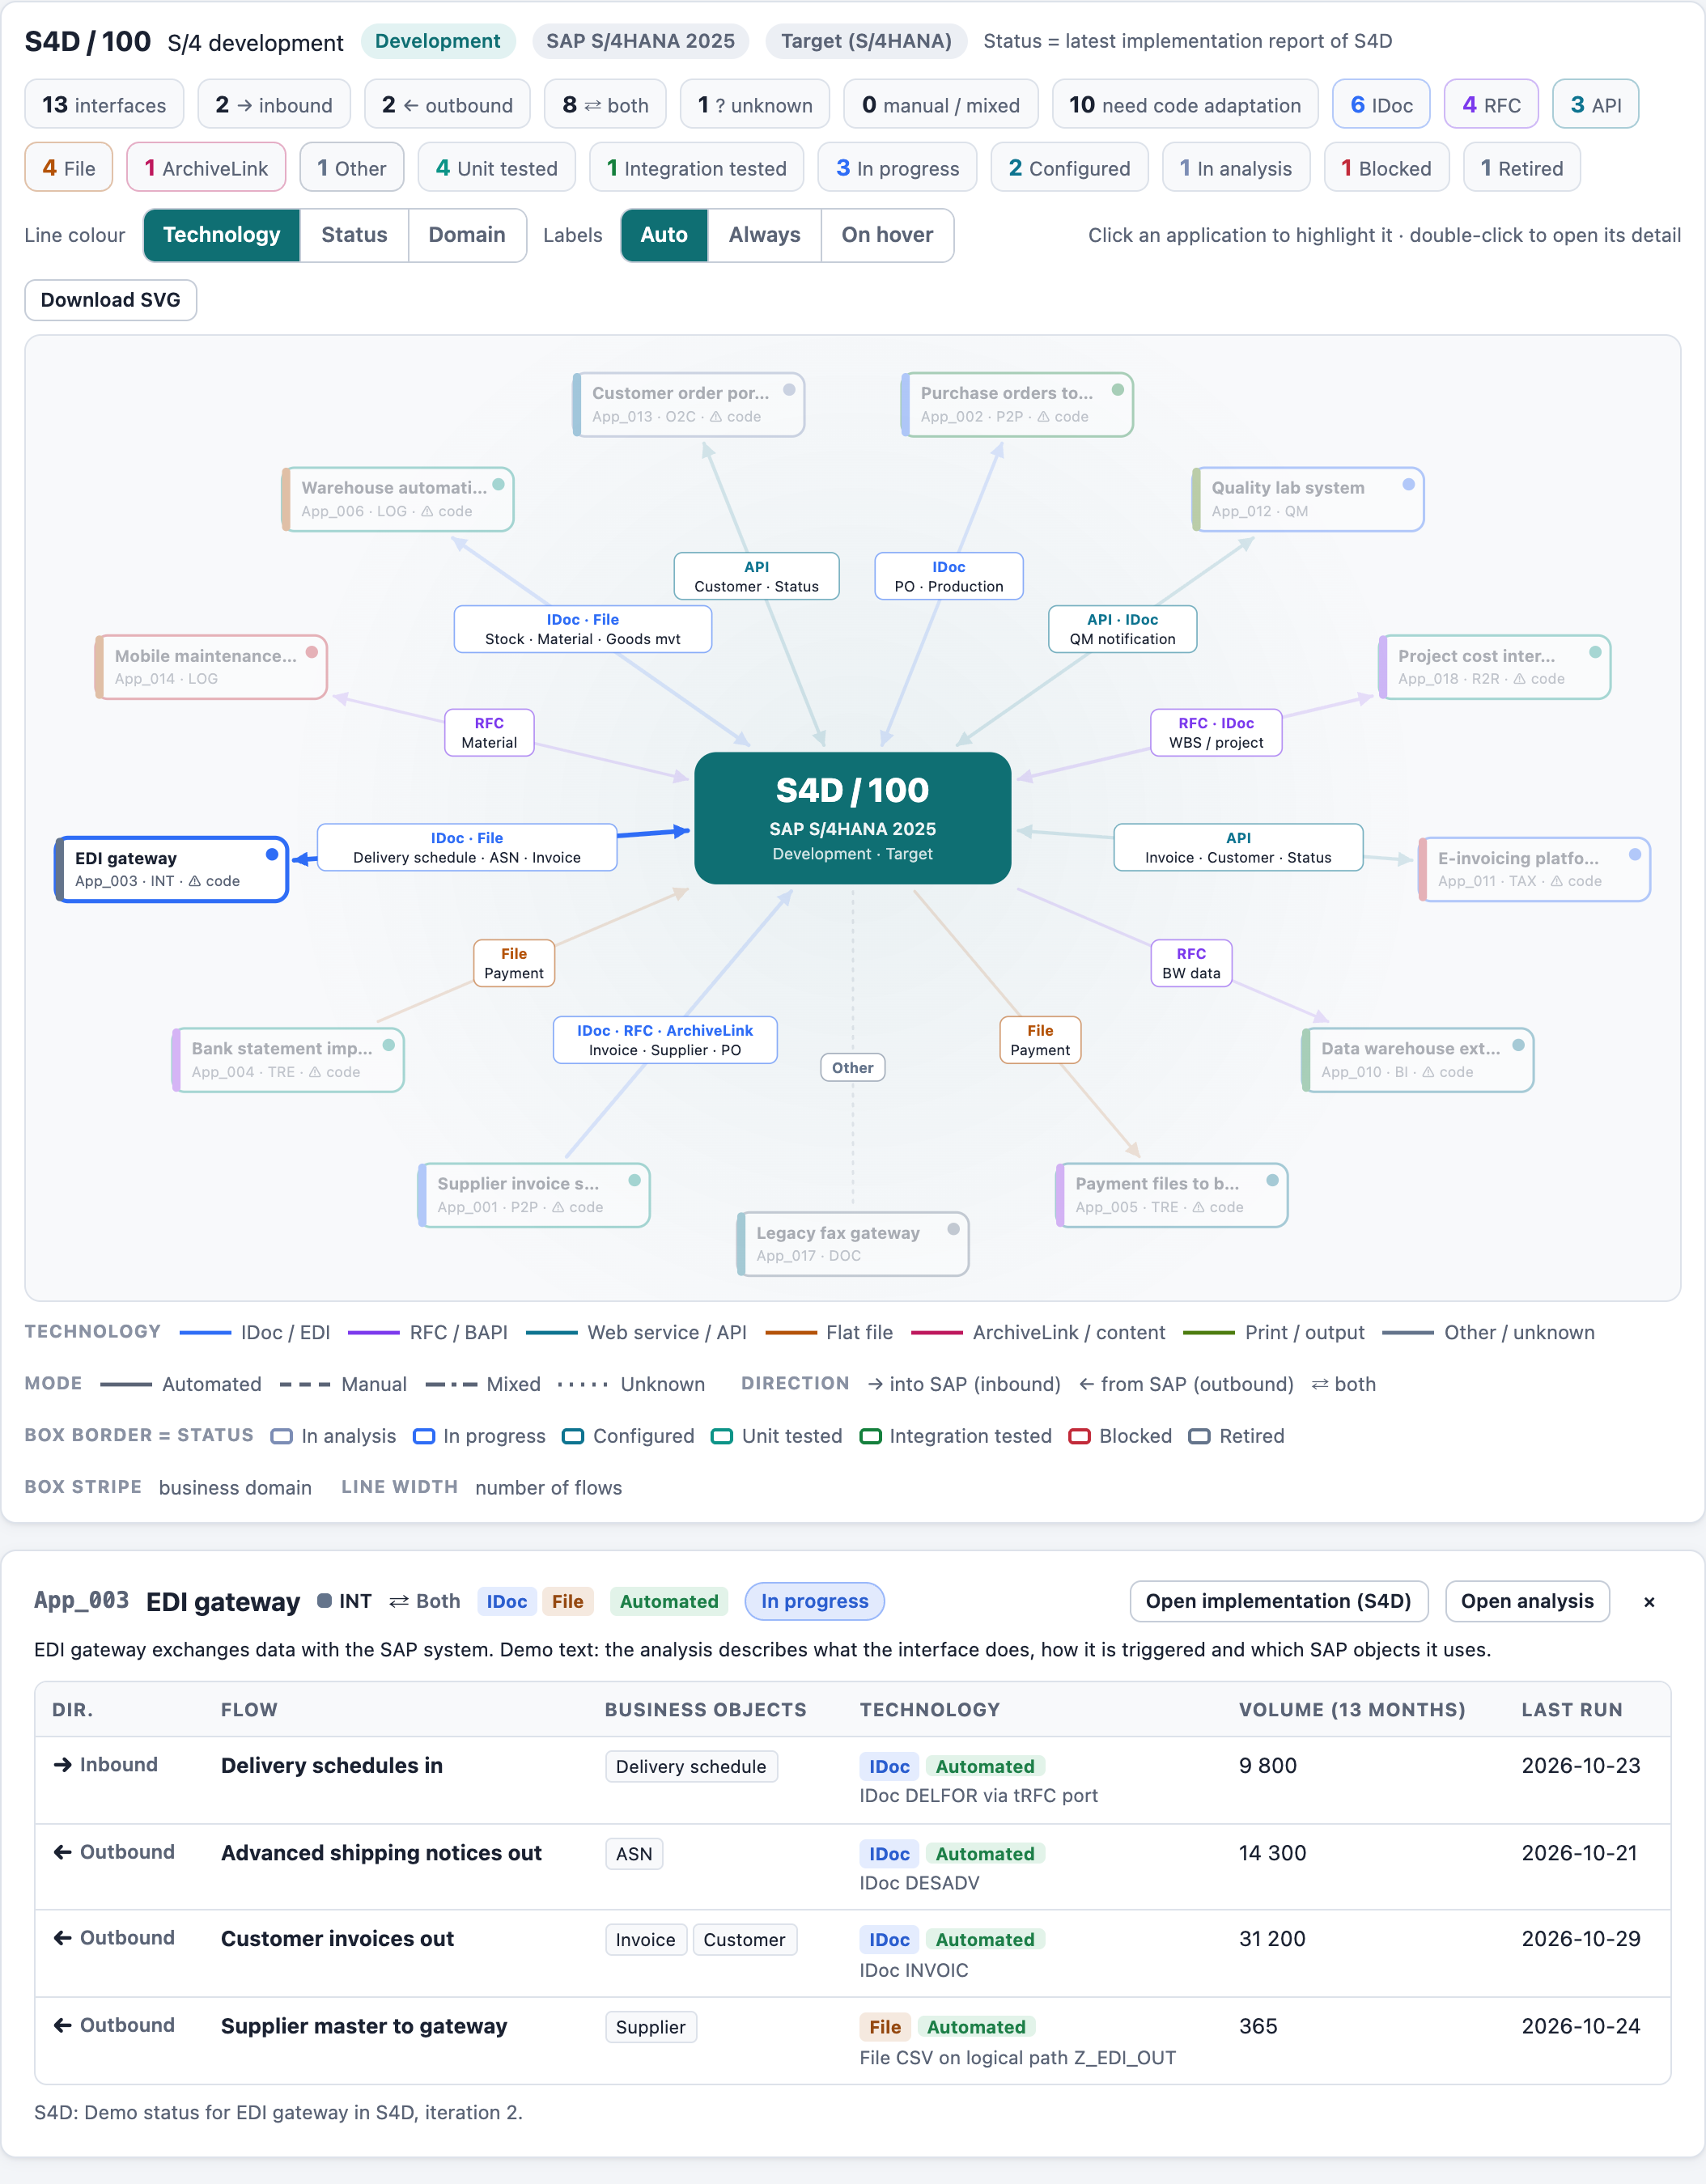
5 — Export
Click Download SVG to save the diagram as a scalable vector image that you can insert in PowerPoint, Word or Visio without loss of quality.
Application landscape
The Application landscape shows, for the applications you select, which instance of each application (e.g. WMS DEV, WMS TEST, WMS PROD) is connected to which SAP instance – and how this changes when the S/4HANA systems are plugged in.
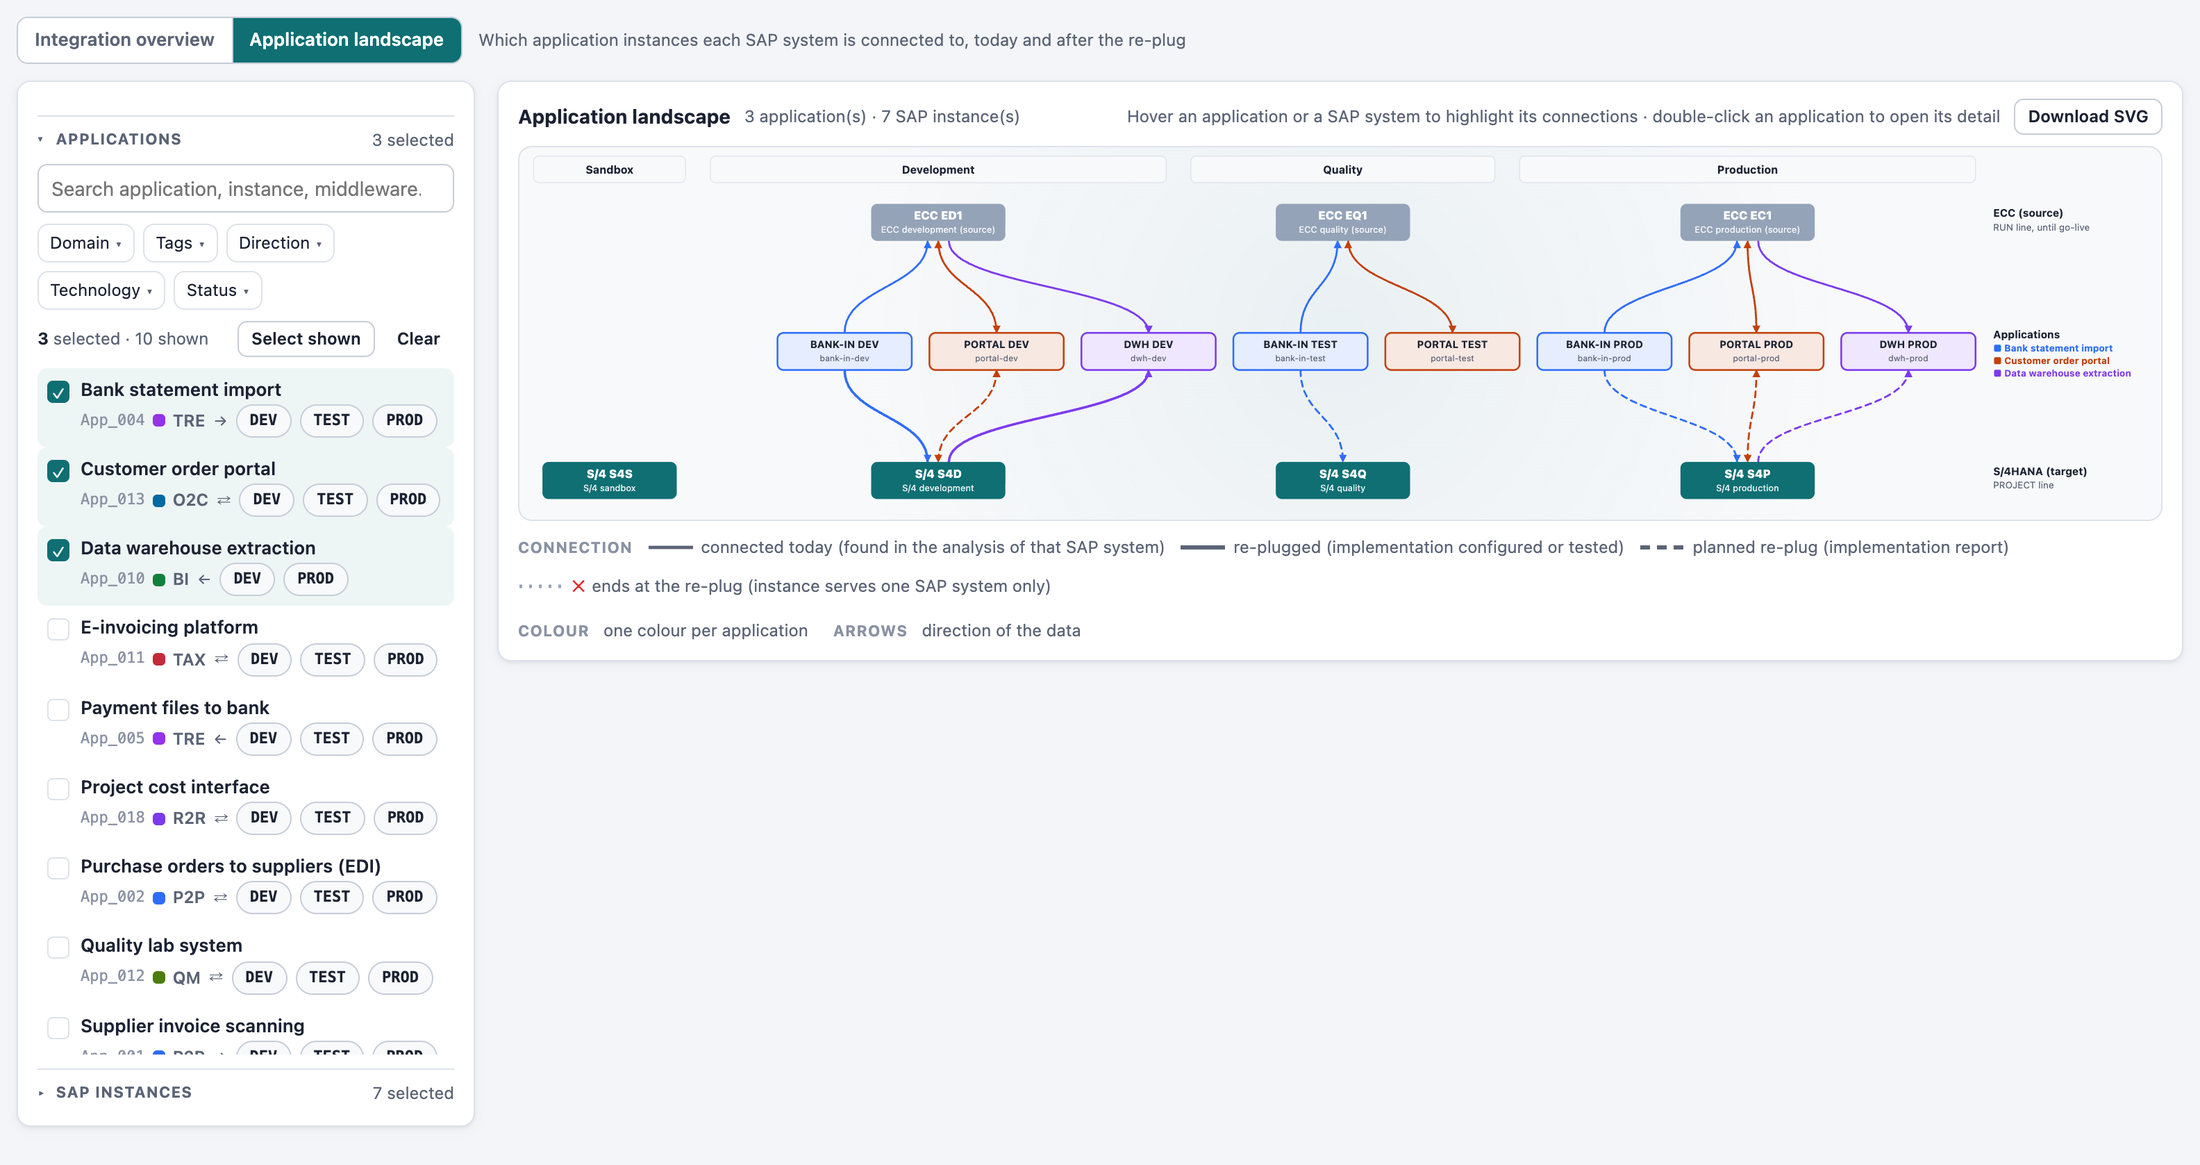
The landscape needs one analysis file per SAP system (e.g. ECC development, quality and production) with the application instances each system is connected to. See Data Files › Application instances. Without them the view shows No application instances yet.
1 — Select applications
The Applications block works like the Interfaces block of the Integration overview:
- The fuzzy search also finds instance names and hosts. An active search or filter selects the applications it shows.
- Filters Domain, Tags, Direction, Technology and Status, and Select shown, Clear, Reset.
- Each row shows the application's instances as tier chips (DEV, TEST, PROD, SBX).
- If selected applications are hidden by the search or filters, a line under the list says how many.
2 — Select SAP instances
The SAP instances block lists the systems of Config › SAP systems, ECC (source) first, then S/4HANA (target), with the number of connections of each.
- The fuzzy search (SID, name, tier, product) and the Tier dropdown (multiple choice: SBX, DEV, TEST, PROD …) select the systems they show. For example, choose SBX and DEV to see the sandbox and development systems only.
- Select shown, Clear and Reset work as above. You can also tick single systems.
Only the application instances connected to the selected SAP systems are drawn, and only the tiers of the selected systems get a column. If a selected application has no connection to the selected systems, the header says so (n application(s) not connected to the selected SAP systems).
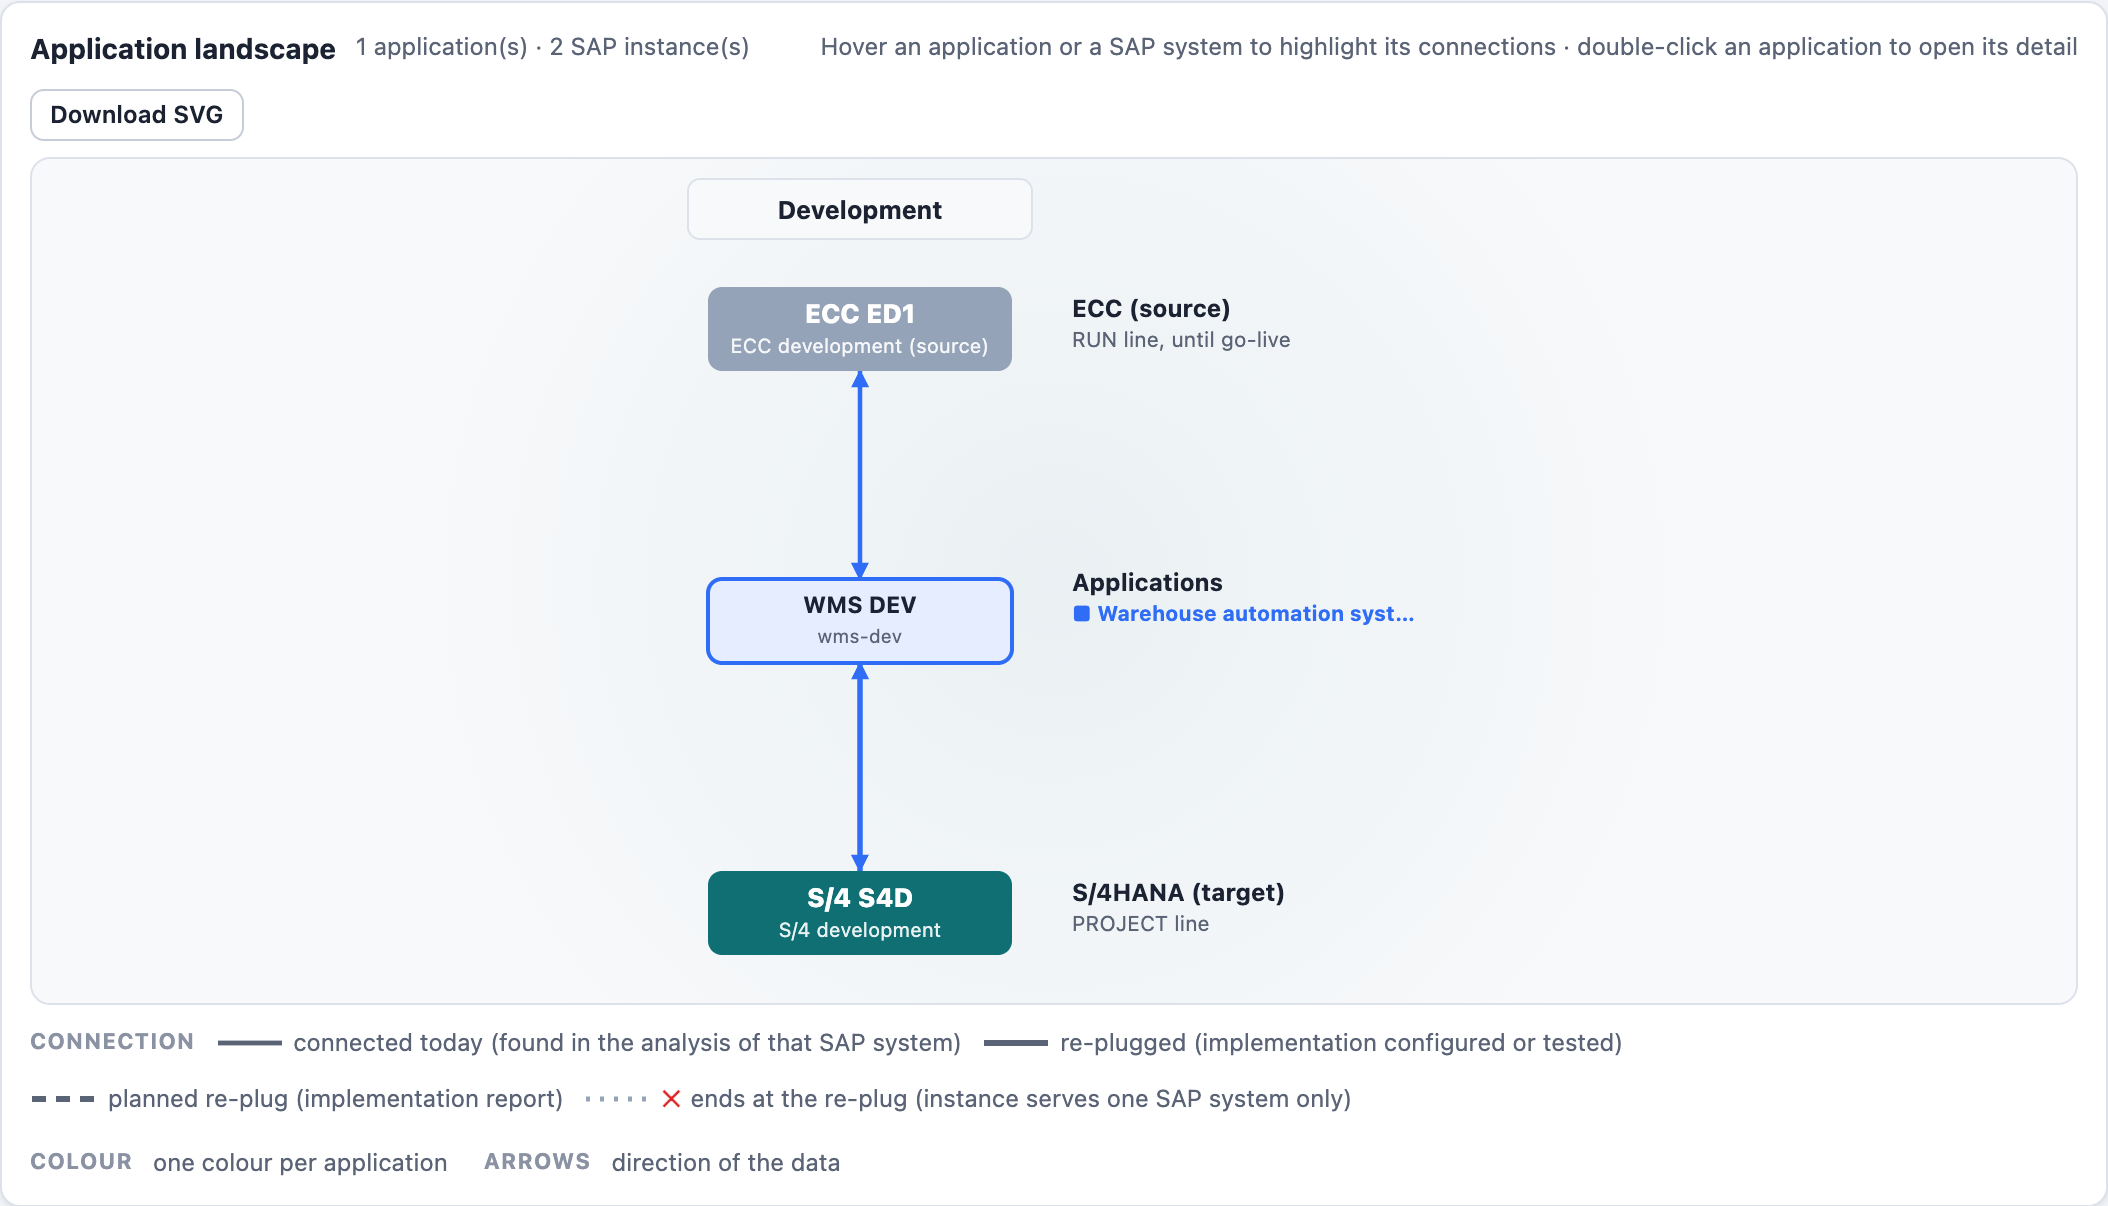
3 — Read the diagram
| Element | Meaning |
|---|---|
| Columns | The tiers of the selected SAP systems: Sandbox, Development, Quality, Production … |
| Top row | ECC (source) systems – the RUN line, until go-live |
| Middle row | Application instances, placed under the SAP systems they are connected to. One colour per application |
| Bottom row | S/4HANA (target) systems – the PROJECT line |
| Arrows | Direction of the data |
| Line | Meaning |
|---|---|
| Solid | Connected today: the connection is in the analysis file of that SAP system |
| Solid, thicker | Re-plugged: the implementation report of the S/4HANA system shows the interface as configured or tested |
| Dashed | Planned re-plug: in the implementation report, not yet configured; or an S/4HANA system without an implementation report (e.g. production, re-plugged at cut-over) |
| Grey dotted with ✕ | Ends at the re-plug: the application instance can be connected to one SAP system only; its ECC connection ends when the S/4HANA system is plugged in |
How the re-plug is derived: an S/4HANA system is connected to the application instance(s) that the ECC system of the same tier uses today (e.g. S/4 QA → the instance ECC QA uses). Hover a line to see its source and status.
4 — Interact and export
- Hover an application or a SAP system to highlight its connections.
- Double-click an application box to open its interface detail on the Analysis page; Back to dashboard returns to the landscape with the same selection.
- Download SVG saves the diagram.